Winter 2020-21 Review of U.S. Put-in-Place Construction Outlook
While the U.S. economy is in recovery mode, it remains under stress in a fashion not seen in more than a century. The onset of the coronavirus health crisis in the Spring caused an unprecedented collapse in economic activity that is being reversed, but more gradually than was initially expected. Hopes for a smooth progression of upwards growth to flow from store and restaurant re-openings have been waylaid by a winter upsurge in COVID-19 infections, with the prospect that demands on the health care system will worsen before beginning to ease once again.
On the upside, effective vaccines developed by several pharmaceutical companies will soon be available to protect the most vulnerable members of the public, with wider distribution to proceed over the first half of next year.
Strength in Residential Real Estate
The construction marketplace is diverging along residential versus nonresidential lines with the former more buoyant than the latter. Major indicators of U.S. residential real estate, focusing on sales, price levels and number of months’ inventory of supply, for both new and existing homes, are showing strength. The jobs recovery ratio for the entire economy, versus February-April’s huge contraction in employment, may presently be only 50%, but that’s not placing much of a damper on the several good reasons for the sizable uptick in housing demand.
With the options for spending on dining-out, theater engagements and so on greatly reduced, the nation’s savings rate has shot up to 15% or more from a long-term average of about 8%. More savings have permitted a faster accumulation of down payments for new homes.
The notion that employees fortunate enough to have retained their positions are racking up savings will figure prominently later in this article. It’s also contributing to record-breaking highs in stock market indices.

Download this article as a PDF.
Table 1: U.S. Construction Spending (put-in-place investment)
(billions of “current” $s)
| Actuals | Forecasts | ||||
| Type of Construction: | 2019 | 2020 | 2021 | 2022 | 2023 |
| Grand Total | 1365.1 | 1424.4 | 1,417.7 | 1,442.3 | 1,491.3 |
| (year vs previous year) | 2.4% | 4.3% | -0.5% | 1.7% | 3.4% |
| Total Residential | 550.9 | 604.0 | 620.9 | 636.4 | 655.5 |
| -2.3% | 9.6% | 2.8% | 2.5% | 3.0% | |
| Total Non-residential | 814.2 | 820.4 | 796.8 | 805.9 | 835.7 |
| 5.8% | 0.8% | -2.9% | 1.1% | 3.7% | |
| Total Commercial/for Lease | 198.4 | 194.8 | 182.1 | 181.3 | 186.1 |
| 2.0% | -1.8% | -6.5% | -0.4% | 2.7% | |
| Lodging | 33.1 | 28.9 | 25.5 | 24.7 | 25.7 |
| 5.1% | -12.5% | -12.0% | -2.9% | 4.0% | |
| Office | 84.9 | 81.5 | 69.7 | 67.5 | 69.6 |
| 10.7% | -4.0% | -14.5% | -3.1% | 3.1% | |
| Commercial (retail/warehouse) | 80.4 | 84.3 | 87.0 | 89.0 | 90.8 |
| -6.9% | 4.9% | 3.1% | 2.4% | 2.0% | |
| Total Institutional | 193.8 | 198.5 | 189.9 | 189.2 | 195.5 |
| 4.4% | 2.4% | -4.3% | -0.4% | 3.4% | |
| Health Care | 45.6 | 48.3 | 49.6 | 51.6 | 54.0 |
| 4.9% | 6.0% | 2.8% | 4.0% | 4.6% | |
| Educational | 105.4 | 104.3 | 97.6 | 96.4 | 99.7 |
| 4.1% | -1.0% | -6.4% | -1.3% | 3.4% | |
| Religious | 3.5 | 3.1 | 3.0 | 2.9 | 2.9 |
| 1.3% | -13.2% | -3.7% | -2.1% | 1.3% | |
| Public Safety | 10.5 | 15.3 | 13.7 | 13.0 | 12.9 |
| 12.6% | 45.5% | -10.6% | -5.4% | -0.5% | |
| Amusement and Recreation | 28.8 | 27.5 | 26.0 | 25.3 | 26.0 |
| 2.6% | -4.5% | -5.6% | -2.5% | 2.9% | |
| Total Engineering/Civil | 341.9 | 353.8 | 353.8 | 362.7 | 378.6 |
| (year vs previous year) | 8.0% | 3.5% | 0.0% | 2.5% | 4.4% |
| Transportation | 57.2 | 56.8 | 51.0 | 50.0 | 53.3 |
| 7.4% | -0.6% | -10.2% | -2.0% | 6.6% | |
| Communication | 22.2 | 22.8 | 23.4 | 24.2 | 25.1 |
| -9.2% | 2.6% | 2.7% | 3.1% | 3.8% | |
| Power | 113.9 | 122.5 | 127.6 | 133.2 | 139.8 |
| 14.4% | 7.6% | 4.1% | 4.4% | 5.0% | |
| Highway and Street | 97.6 | 97.7 | 99.1 | 102.0 | 105.5 |
| 6.3% | 0.2% | 1.4% | 3.0% | 3.4% | |
| Sewage and Waste Disposal | 26.1 | 26.4 | 26.7 | 27.1 | 27.9 |
| 9.0% | 1.4% | 1.0% | 1.5% | 2.8% | |
| Water Supply | 15.9 | 19.0 | 17.6 | 17.6 | 18.0 |
| 2.6% | 19.4% | -7.4% | 0.0% | 2.7% | |
| Conservation and Development | 9.1 | 8.5 | 8.4 | 8.6 | 9.0 |
| 10.9% | -6.8% | -1.2% | 2.8% | 3.7% | |
| Total Industrial/Manufacturing | 80.1 | 73.4 | 71.0 | 72.7 | 75.5 |
| 10.4% | -8.4% | -3.2% | 2.4% | 3.8% | |
“Current” means not adjusted for inflation.
Source of actuals: U.S. Census Bureau / Forecasts: ConstructConnect.
Table: ConstructConnect.
Graph 1: U.S. Grand Total Construction Spending
Put-in-place (PIP) Investment
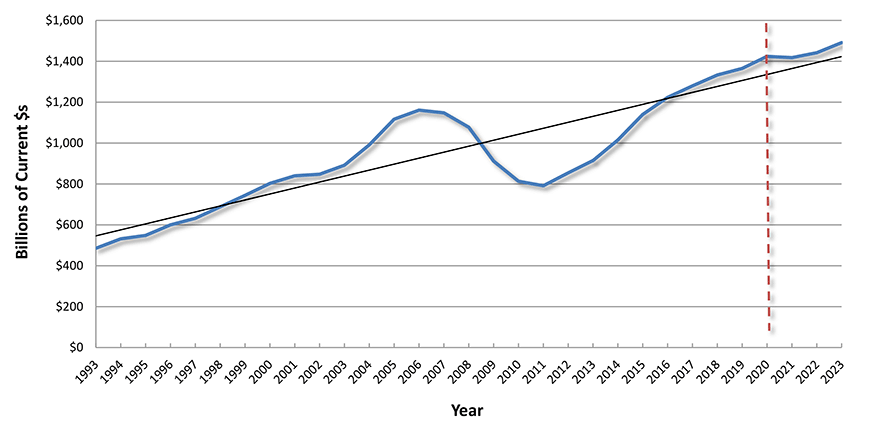
Graph includes a ‘best fit’ linear trend line.
Source of actuals: U.S. Census Bureau / Forecasts: ConstructConnect.
Chart: ConstructConnect.
Mobility Issues
The successful implementation and widespread acceptance of the ‘work from home’ concept has brought mobility back into play. More mobility means more turnover in residential real estate.
Fifty years ago, 20% of the U.S. population would move per annum. That proportion has been diminishing over the intervening decades, most recently settling on 10%. But a shake-up is emerging. Millennials have been eyeing moves to the suburbs to recapture the lifestyles of their parents and grandparents. Extra impetus is now being provided by a wish to escape what is being perceived, for the moment at least, as unhealthy downtown urban crowding.
There’s also a trend underway for individuals and families to move away from high cost and weather-threatened coastal regions towards the interior. Climate change has been bringing a greater incidence of wildfires and hurricanes. Acquiring and paying for homeowner insurance is often proving problematic along stretches of the Pacific, Gulf and southern Atlantic shorelines.
Speaking of affordability, another spur to residential construction is the present exceptionally low level of mortgage rates. Purchasers are locking in long-term fixed financing at 3.00% or lower, the best bargain in history.
U.S. annual housing starts have been below the 1.6 million-unit figure considered to be ‘equilibrium’ for years. The word ‘equilibrium’ is used in the sense of being that level consistent with population growth and family formations. The annual average of U.S. housing starts since 2000 has been 1.25 million units. Many analysts are counting on the fulfilment of ‘pent-up’ housing needs to drive their upbeat gross domestic product (GDP) growth forecasts.
Caveats on the Home Front
There are some caveats to be mentioned. For starters, a careful reading of the above paragraphs reveals that the positives for residential construction favor the single-family segment over multiple units.
Also, keep in mind that population growth in the U.S. has been slowing. A primary reason has been fewer immigrant arrivals, whether legal or not. Foreign students and foreign temporary workers are major sources of rental living space demand. They are no longer providing the same degree of reliable underpinning that landlords previously counted on.
Gray Tones, with Flashes of Brightness, in Nonresidential Markets
The nonresidential construction picture features gray tones, but with occasional flashes of brightness. The Census Bureau’s put-in-pace construction spending numbers have been receiving notable support from projects initiated a year ago.
According to ConstructConnect, 2019 included the greatest number of mega project start-ups of a billion dollars or more each in recent memory. There were 35 such projects adding to $79 billion in 2019 compared with 20 in 2018 for $47 billion and 25 in 2017 for $55 billion. Many of 2019’s mega projects were super-big energy undertakings such as pipelines, petrochemical plants and LNG export terminals.
Several factors are currently working to inhibit energy mega project approvals. There’s the inherent risk in authorizing such big jobs while a pandemic is still raging. Also, a changing of the guard is underway in Washington that will see a priority shift towards ‘green’ initiatives and sustainability. Electric power projects utilizing wind, solar and geothermal technology will be welcomed.
Plus, a next wave of environmental activism will be targeting the production of non-decomposable plastics. Finally, there are the weak global prices for oil and natural gas which are acting to curb related investment enthusiasm.
Transportation Project Outlook
Prior to the coronavirus landing on America’s shores, there were long lists of transportation projects on the drawing boards. Nearly every major city was boasting of light rapid transit work and expansions at their international airports. With travel worldwide down so drastically, and commuter volumes so curtailed, many of these projects are likely to be postponed.
There’s a counter argument to be made just the same. Word from the airline industry is that it doesn’t expect to be back to ‘normal’ for another couple of years. Perhaps that’s being too pessimistic. Many people are addicted to travel. Immunizations that are now expected to blanket the population by next summer will provide the confidence for passengers to once again pack planes. And they are currently padding their bank accounts to do so.
More people in motion will also be a huge boost to the hotel and motel industry which is currently in a deep funk. Room occupancy rates, jobs levels and capital spending in the accommodation sector in 2020 have all nose-dived.
Local and State Government Finances in Disrepair
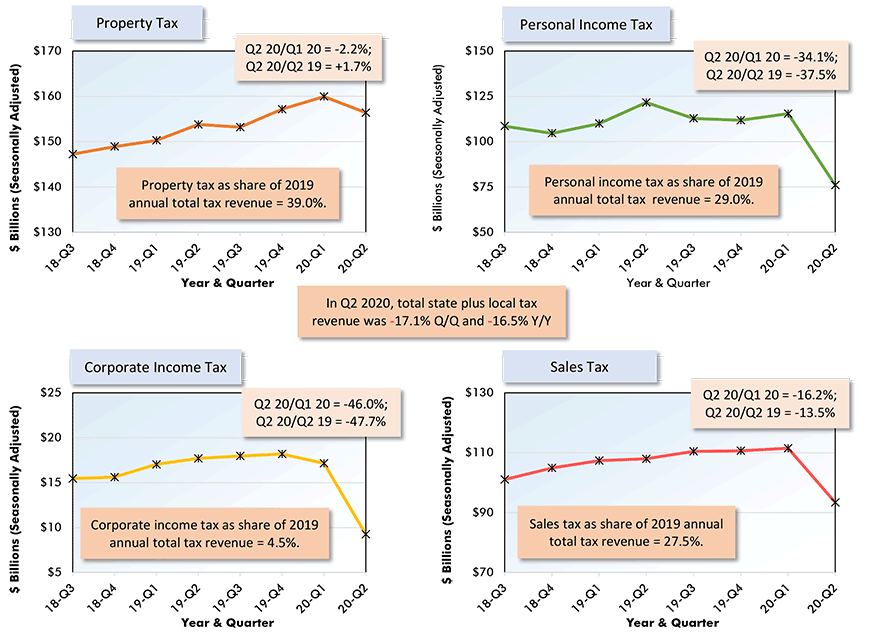
There’s also the unfortunate matter of how much state and local governments will be able to afford for the next little while. Total state and local government tax receipts in the second quarter of this year were -17.1% below their first quarter level. On a year-over-year basis, they were -16.5%.
There are four sources of state and local government tax revenue. Property taxes in Q2 declined the least compared with Q1, -2.2%. Outsized plunges, however, were recorded in personal income tax receipts (-34.1% Q/Q), corporate income tax earnings (-46.0% Q/Q) and sales tax revenues (-16.2% Q/Q).
Educational and Health Care Projects
The steadiness in property tax income will prop up K-12 school facility capital spending, with more emphasis being placed on renovation work for the time being. At the level of higher education, the portion of the business model dependent on tuition fees will suffer a setback as more students embrace online instruction and foreign students pay more attention to alternative options in other countries.
Health care construction, looking forward, will benefit from several factors. There’s the demographics of an aging population that will increasing need more procedures. With the Democrats installed in the White House, threats to the Patient Protection and Affordable Care Act will recede, providing more assured revenue streams for hospitals. Design flaws in seniors’ and nursing homes (and prisons, for that matter) will demand correction to allow for isolation of residents requiring specialized care in the event of a next viral infection outbreak.
Also, speculation concerning pent-up demand arising in residential construction has nothing on the backlog of medical case work that has been piling up. All manner of elective surgeries have been postponed while emergency room resources have been harnessed to stem the spread of the coronavirus.
Knowing that inoculations in 2021 will beat back the coronavirus assault, those moments when pent-up demand in key corners of the economy will be unleashed are becoming tantalizing closer.
It’s No Longer the ‘Old Retail’
There are two major components to the consumer spending in the economy that accounts for 70% of U.S. GDP. Spending on services such as meals out and vacations away from home is where the deepest cuts have been felt. Expenditures on most retail goods, though, have exhibited astonishing resiliency. They’ve been one of the few pockets of the economy to demonstrate the much talked about and beloved V-shaped recovery.
It’s no longer the ‘old retail’, however. The shift in purchases from ‘bricks and mortar’ locations to digital platforms that was already taking place before the pandemic has vastly accelerated. Monthly non-store retail sales since March have consistently been ahead by one-third to one-quarter year over year. It’s no wonder shopping mall owners and their tenants have been in such trouble.
The response of some mall owners to the dangers presented by rents slipping into arrears has been to take equity positions in key lessees. Another answer has been to fill hollowed-out square footage in non-typical ways. Vacant retail space is being converted to residential units, car dealerships, and most logical of all, medical clinics. Doctors, nurses, support staff and patients all add to foot traffic past storefronts.
There’s an interesting retail-related aside to construction activity being judged ‘essential’ nearly everywhere in America throughout the pandemic. Year-over-year sales by building material suppliers, unlike what has occurred in most other shopkeeper categories, have never gone into decline.
Warehouse & Data Center Work Speeding Ahead
The flip side of challenges in the retail sector has been tremendous opportunities, with accompanying capital spending, in fulfilment and warehousing activity. The biggest high-tech firms, with plenty of cash to draw on, have been rapidly expanding their distribution reach. If a mega project is defined as a million square feet or more, as opposed to a billion dollars, then the volume of such starts in 2020 has been more than level with 2019.
Through October of 2019 there were start-ups on 20 projects of a million square feet or more adding to 46 million square feet. Through the first ten months of 2020, there have been 23 such project initiations summing to 49 million square feet.
Alphabet/Google, Amazon, Apple, Facebook and Microsoft as a grouping (FAAMG) are not just the backbone of stock market advances. Contrary to the hesitancy being displayed by many other owners, they are hurrying ahead not just with warehousing projects, but also sprawling data center and campus complexes. In the process, they are becoming some of the largest real estate holders in the land. The value of property owned by Alphabet and Amazon has been estimated at $40 billion each and growing.
Furthermore, when a large tech company moves into a neighborhood, there’s a ‘pod effect’ whereby other supplier companies and ancillary service firms gravitate nearby. Hikes in rent meet the disapproval of anti-gentrification advocates.
The Office Building Market
Office tower construction is running into the headwind of the ‘work from home’ movement. Developers are mopping their brows worrying and wondering about the degree to which home offices will become the rule.
The pendulum will undoubtedly swing back towards greater office attendance once again. There are too many advantages. Proximity aids collaboration and training. But many individuals are liking the extra time spent with family, rather than on the road or in a subway car. Some form of hybrid scheduling of home versus office appearances will become common with many companies.
Manufacturing and Some Engineering Categories to Gain from Single-Family Uplift
The manufacturing sector in the U.S. can take encouragement from several recent developments. Both the new USMCA agreement and the ‘Buy America’ platform adopted by the Democrats protect and promote U.S. jobs. The disruptions in supply chains with linkages to Asia, earlier this year, are giving rise to de-globalization efforts.
But capacity utilization rates among manufacturing sub-sectors will need to increase well past the 70% levels they’ve generally been stuck at before expectations of expansion plans can be given much free rein.
The food and beverage manufacturing sub-sector, which employs more people than the motor vehicle and parts industry, may be a special case. High-profile and debilitating coronavirus outbreaks at labor-intensive meat packing plants will force processing-line modifications. More cold storage capacity has also come to the forefront as a necessity.
Additionally, the positive outlook for single-family suburban home building is good news for manufacturing. All the items going into making a new residence comfortable (e.g., appliances, electronics, HVAC systems, etc.) roll off plant production lines.
Also worthy of mention, of course, is that heightened single-family construction laid out in grids is of benefit to all manner of infrastructure suppliers, including roadbuilders and sewer and watermain contractors.
Finally, there’s also good news emanating from the ‘amusement’ category of construction. There are seven soccer stadiums in various stages of advancement across America. In 2022, pro soccer will be widening its city presence from 26 teams to 30.
Graph 2: U.S. Construction Spending: Total Residential
Put-in-place (PIP) Investment
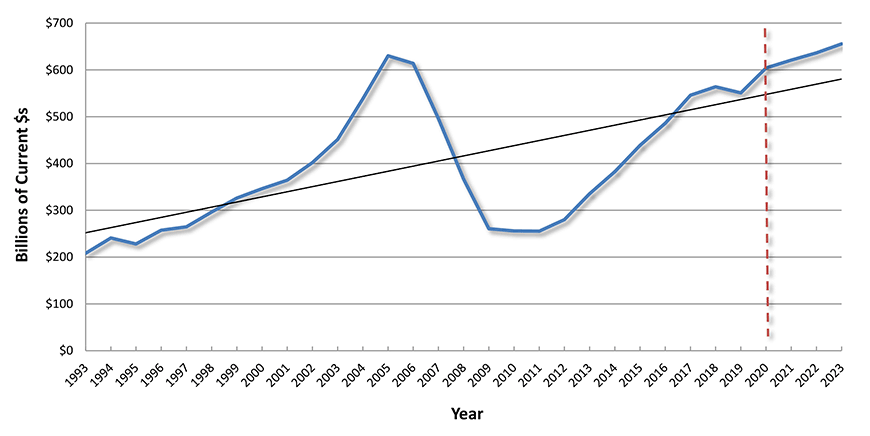
Graph includes a ‘best fit’ linear trend line.
Source of actuals: U.S. Census Bureau / Forecasts: ConstructConnect.
Chart: ConstructConnect.
Graph 3: U.S. Construction Spending: Total Nonresidential
Put-in-place (PIP) Investment
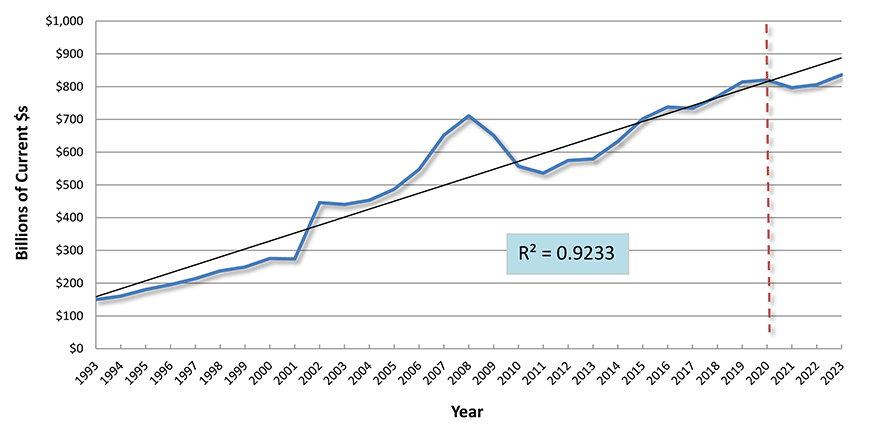
Graph includes a ‘best fit’ linear trend line.
R2 is a measure from the field of statistics. It calculates the degree of ‘fit’ between actual values and a trend line. Its value ranges from 0.00 to 1.00. The closer the figure is to 1.00, the better the correlation.
Source of actuals: U.S. Census Bureau / Forecasts: ConstructConnect.
Chart: ConstructConnect.
Graph 4: U.S. Construction Spending: Lodging
Put-in-place (PIP) Investment
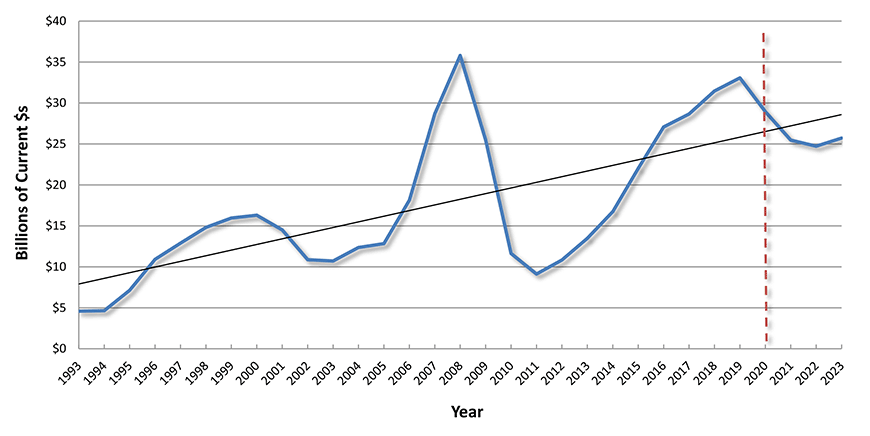
Graph includes a ‘best fit’ linear trend line.
Source of actuals: U.S. Census Bureau / Forecasts: ConstructConnect.
Chart: ConstructConnect.
Graph 5: U.S. Construction Spending: Office Buildings
Put-in-place (PIP) Investment
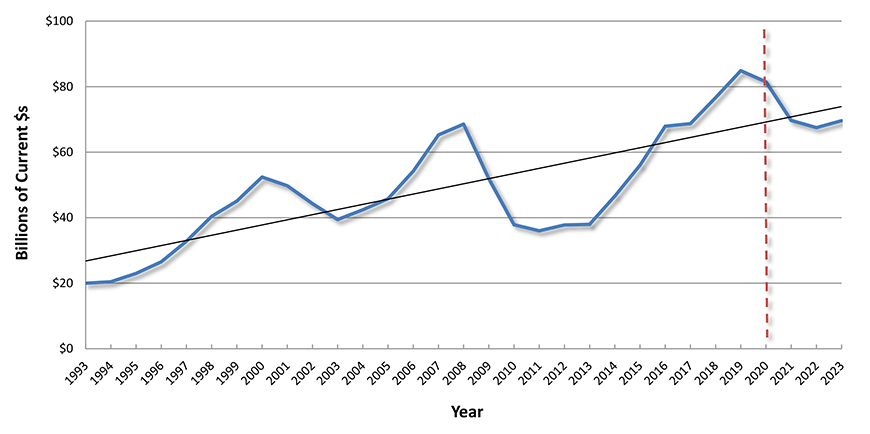
Graph includes a ‘best fit’ linear trend line.
Source of actuals: U.S. Census Bureau / Forecasts: ConstructConnect.
Chart: ConstructConnect.
Graph 6: U.S. Construction Spending: Commercial (Retail, Warehouses, Restaurants)
Put-in-place (PIP) Investment
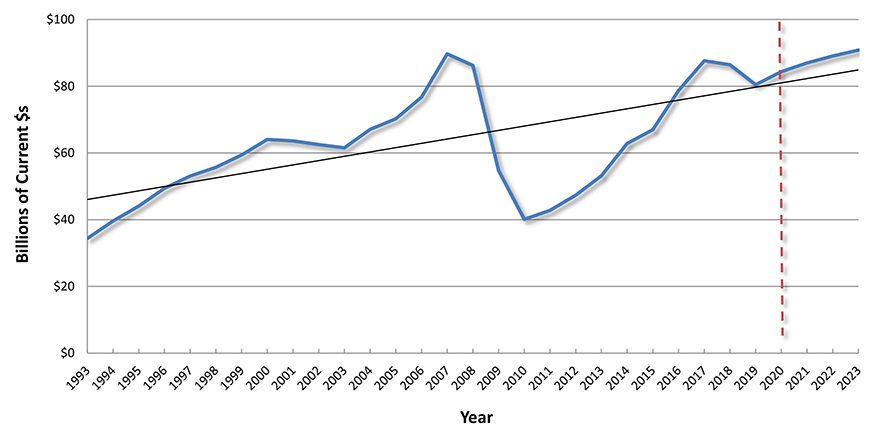
Graph includes a ‘best fit’ linear trend line.
Source of actuals: U.S. Census Bureau / Forecasts: ConstructConnect.
Chart: ConstructConnect.
Graph 7: U.S. Construction Spending: Health Care
Put-in-place (PIP) Investment
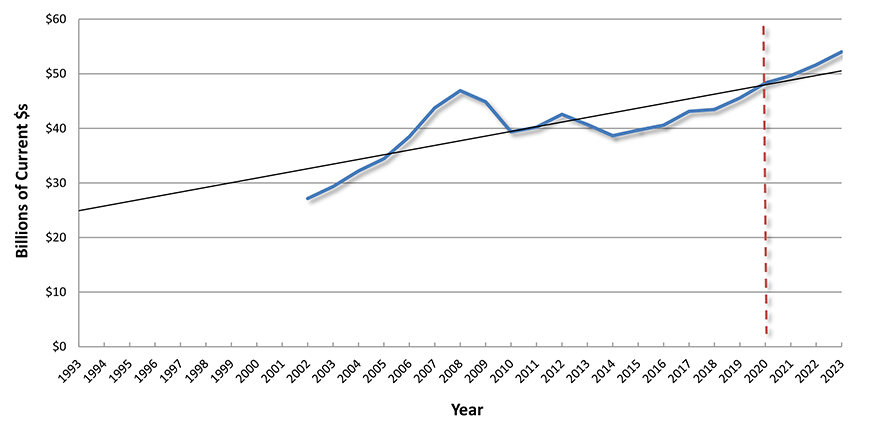
Graph includes a ‘best fit’ linear trend line.
Numbers for this series prior to 2002 are no longer consistent with more current data.
Source of actuals: U.S. Census Bureau / Forecasts: ConstructConnect.
Chart: ConstructConnect.
Graph 8: U.S. Construction Spending: Educational
Put-in-place (PIP) Investment
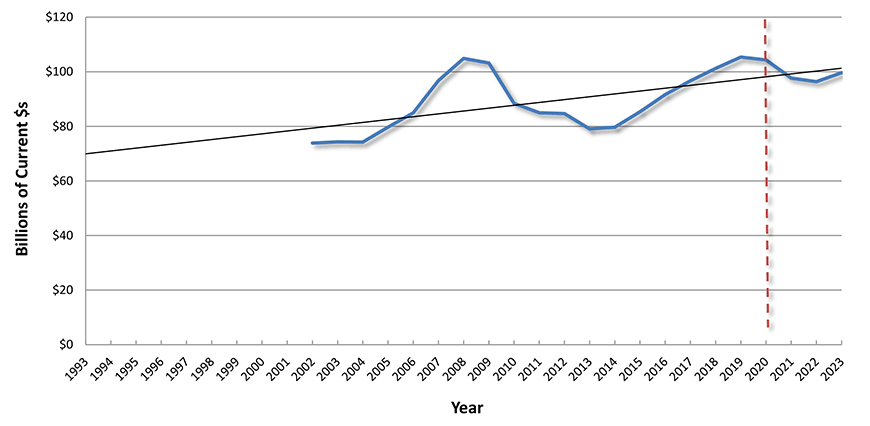
Graph includes a ‘best fit’ linear trend line.
Numbers for this series prior to 2002 are no longer consistent with more current data.
Source of actuals: U.S. Census Bureau / Forecasts: ConstructConnect.
Chart: ConstructConnect.
Graph 9: U.S. Construction Spending: Manufacturing
Put-in-place (PIP) Investment
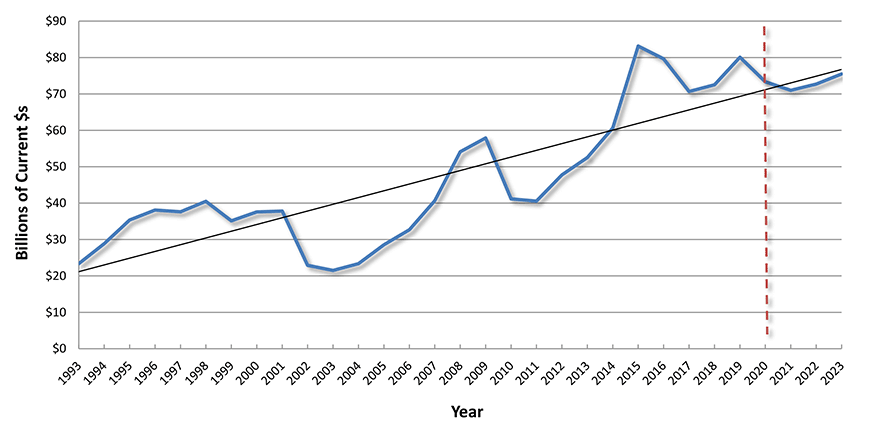
Graph includes a ‘best fit’ linear trend line.
Source of actuals: U.S. Census Bureau / Forecasts: ConstructConnect.
Chart: ConstructConnect
Graph 10: U.S. Construction Spending: Total Engineering
Put-in-place (PIP) Investment
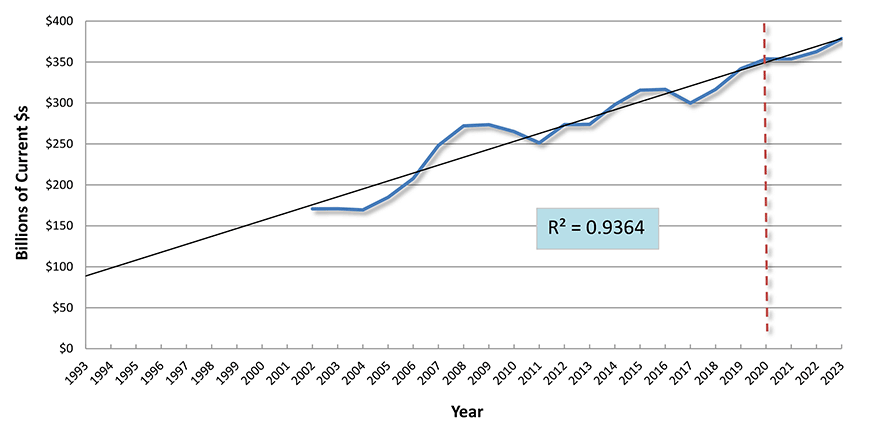
Graph includes a ‘best fit’ linear trend line.
R2 is a measure from the field of statistics. It calculates the degree of ‘fit’ between actual values and a trend line. Its value ranges from 0.00 to 1.00. The closer the figure is to 1.00, the better the correlation.
Numbers for this series prior to 2002 are no longer consistent with more current data.
Source of actuals: U.S. Census Bureau / Forecasts: ConstructConnect.
Chart: ConstructConnect
Graph 11: U.S. Construction Spending: Highways and Streets
Put-in-place (PIP) Investment
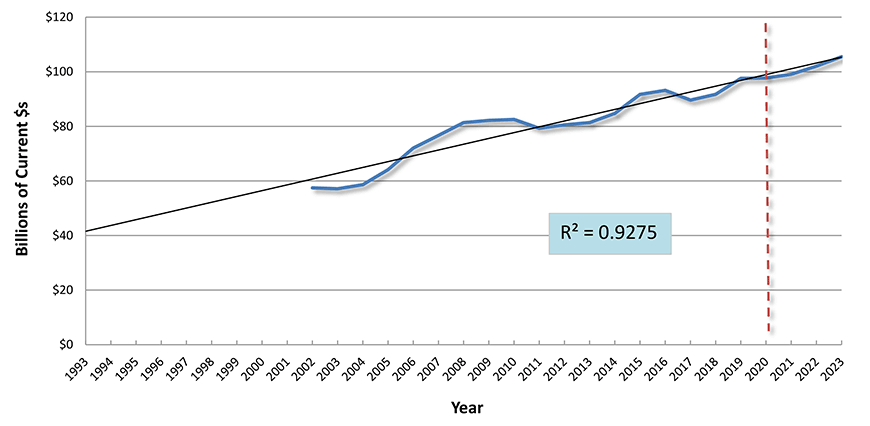
Graph includes a ‘best fit’ linear trend line.
R2 is a measure from the field of statistics. It calculates the degree of ‘fit’ between actual values and a trend line. Its value ranges from 0.00 to 1.00. The closer the figure is to 1.00, the better the correlation.
Numbers for this series prior to 2002 are no longer consistent with more current data.
Source of actuals: U.S. Census Bureau / Forecasts: ConstructConnect.
Chart: ConstructConnect
Graph 12: U.S. Construction Spending: Water Supply, Sewage & Waste Disposal, Conservation & Development
Put-in-place (PIP) Investment
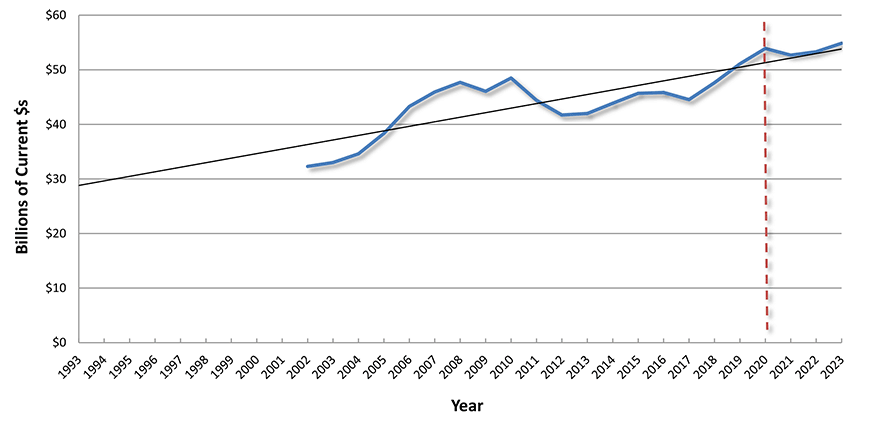
Graph includes a ‘best fit’ linear trend line.
Numbers for this series prior to 2002 are no longer consistent with more current data.
Source of actuals: U.S. Census Bureau / Forecasts: ConstructConnect.
Chart: ConstructConnect
Graph 13: U.S. Construction Spending: Power
Put-in-place (PIP) Investment
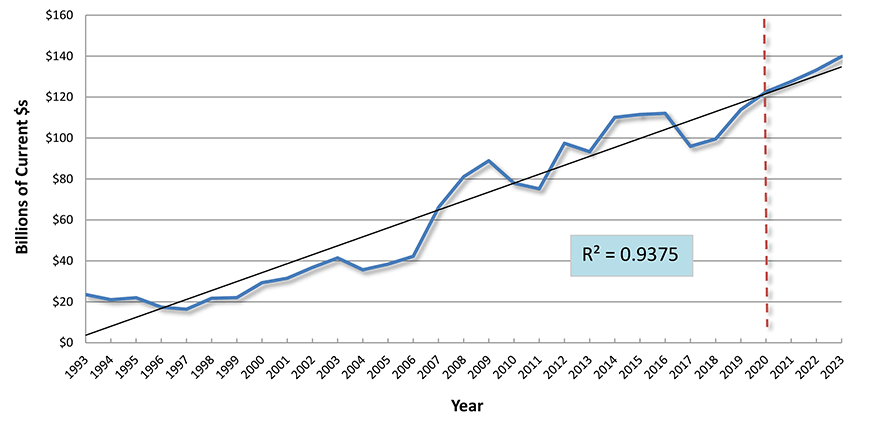
Graph includes a ‘best fit’ linear trend line.
R2 is a measure from the field of statistics. It calculates the degree of ‘fit’ between actual values and a trend line. Its value ranges from 0.00 to 1.00. The closer the figure is to 1.00, the better the correlation.
Source of actuals: U.S. Census Bureau / Forecasts: ConstructConnect.
Chart: ConstructConnect
Graph 14: Tax Sources of U.S. State +
Local Government Revenues
The Renovation Story
In addition to the lump sum versus work-in-progress explanation, there’s another significant reason PIP statistics are larger and smoother than ‘starts’ data. Since capital expenditures yield important line items in the national accounts (i.e., GDP), the Census Bureau must estimate the ‘total universe’ of construction spending, including all renovation work. ‘Starts’ are built up from individual projects uncovered by ConstructConnect’s research team. A full accounting of the myriad medium- and smaller-sized renovation jobs (including DIY efforts) underway on a project by project basis is impossible.
With so many individuals shifting to work-from-home status and freeing up time to undertake ‘To Do’ list projects, and with some other key trends gaining headway, such as restaurants racing to build outdoor patios, 2020 has shaped up as a banner year for ‘sidebar’ construction activity. In the commercial and industrial building fields, interior changes to structures to meet new safety and health compliance standards will likewise improve the prospects for renovation work.
The Mega Projects Story
A mega-sized construction project has a dollar value of $1 billion or more.
In 2017, there were 25 mega project starts adding to $54.9 billion (15% of total nonresidential starts)
In 2018, there were 20 mega project starts adding to $47.2 billion (12% of total nonresidential starts)
In 2019, there were 35 mega project starts adding to $79.1 billion (15% of total nonresidential starts)
—-
Through October 2019, there were 29 mega project starts adding to $72 billion
Through October 2020, there have been 10 mega project starts adding to $17 billion
The number of mega projects year to date in 2020 is 10/29 = -66% (minus one-third);
The total $ volume of mega projects year to date in 2020 is $17b/$72b = -76% (minus three-quarters).
—-
BUT HERE’S SOMETHING REALLY INTERESTING…
Let’s re-set the definition of a ‘mega’ project to be one million square feet or more.
Through October 2019, there were 20 such projects adding to 45.6 million square feet.
Through October 2020, there have been 23 such projects adding to 48.6 million square feet.
2020 is beating 2019 for big square footage projects:
2019’s mega projects featured engineering works (in transit & energy) with little or no square footage;
2020 has battery & steel plants & warehouse projects (FAAMG owners) with low $s per sq. ft.
Also see, “Interactive Visual: U.S. 2020 Mega Construction Project Starts“.
Appendix A: ‘Starts’ versus ‘Put-in-place’ Statistics
The Census Bureau’s put-in-place (PIP) statistics are like progress payments or ‘work-in-process’ payments as a project proceeds.
ConstructConnect’s ‘starts’ figures are built-up. They are based on specific project-value estimates, with the full dollar amount entered at the beginning.
Consider a $60 million office tower for which ground is broken in July 2020. It will appear in the Census Bureau’s numbers as spending of approximately $15 million this year; $25 million next year; and the final $20 million in 2022.
For the ‘starts’ series, the entire estimated value ($60 million) will be entered in July 2020.
The starts are more volatile. Their cyclical swings are greater; their amplitudes wider. But they are also ‘leading indicators’ for the investment numbers. A cyclical peak for starts will appear before a cyclical peak for the PIP series. The same goes for cyclical troughs.
Alex Carrick is Chief Economist for ConstructConnect. He has delivered presentations throughout North America on the U.S., Canadian and world construction outlooks. Mr. Carrick has been with the company since 1985. Links to his numerous articles are featured on Twitter @ConstructConnx, which has 50,000 followers.

